Explain why;
(i).Leaf strips of equal dimensions were used? (03 marks)
Leaf strips of equal dimensions were used to have comparable osmotic effects in all solutions and generate comparable results; for accuracy/ minimizing experimental errors.
(ii).Epidermal strips were mounted in the same bathing solution? (02 marks)
Epidermal Strips were mounted in the same bathing solution to maintain the osmotic conditions of the strips as they are observed under the microscope.
(iii).Equal volumes of the bathing solution were used? (02 marks)
Equal Volumes of bathing solution were used to have comparable osmotic effects in the different test tubes
(iv).Epidermal strips were used for mounting? (02 marks)
Epidermal strips were used for mounting since the epidermal cells are thin and can undergo rapid osmotic changes that are easy to observe within a short time.
(d).Determine the sucrose solution that relates to the water potential of the cells in this investigation. Explain your answer (04 marks)
0.42M sucrose concentration, at this concentration there is 50% plasmolysis. The cells plasmolysed equal the cells that are turgid. This implies that loss of water and uptake of water by osmosis are in equilibrium. Hence no net osmosis occurs in this isotonic solution.
(e).With reference to the test tubes with 0.2M and 0.7M sucrose concentration, suggest what would happen by the end of the experiment to:
(i).the volume and density or the batting solution (06 marks)
With 0.2M sucrose concentration, the solution is hypotonic, the cells would take up water by osmosis from the bathing solution. This implies that the volume of the bathing solution decreases and hence its density would decrease. With 0.7M sucrose concentration the solution is hypertonic, the cells would lose water by osmosis to the bathing solution. This implies that the volume of the bathing solution would increase and hence its density would increase.
(ii).Solute potential and water potential (04 marks)
In 0.2M sucrose solution the water potential and solute potential would increase i.e. become less negative due to the osmotic uptake of water from the hypotonic solution. In 0.7M sucrose solution the water potential and solute potential would decrease i.e. become more negative due to the osmotic loss of water to the hypertonic solution.
Question 2.
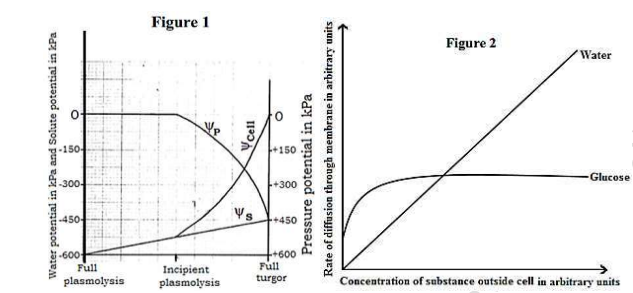
Figure 1 shows changes in the different potentials of a fully plasmolysed plant cell placed in a hypotonic solution. Figure 2 shows the rate of movement of two different substances across a phospholipid membrane; glucose by facilitated diffusion and water by simple diffusion, at varying extracellular concentration.
(a). From figure 1, compare the changes in pressure potential and water potential from full plasmolysis to full turgor. (05 marks)
Similarities
Both ψcell and ψp generally increase from incipient plasmolysis to full turgidity
For both ψcell and ψp, attain maximum at full turgidity
Differences
| Pressure potential |
Water potential |
| Non-existent between full plasmolysis and incipient plasmolysis |
Increases slowly between full plasmolysis and incipient plasmolysis |
| Attains a higher maximum value at full turgidity |
Attains lower maximum value at full turgidity |
| Increase in pressure potential begins at incipient Plasmolysis |
Increase in water potential begins at full plasmolysis |
| Non-existent at full plasmolysis |
Extremely low at full plasmolysis |
(b). As indicated in figure 1, explain the change that occur in water potential from full plasmolysis to full turgor. (15 marks)
Initially water potential is very low/most negative; because of highest concentration of solutes since pressure potential is zero; water potential is equal to solute potential; thus water potential is 100% dependent on solute potential; Water potential increases slowly/becomes less negative from full plasmolysis to incipient plasmolysis because the cell has began taking in water by osmosis & the solute potential becomes less negative and so does the water potential. At incipient plasmolysis, water potential begins to increase more rapidly because the proto-plasmic contents have just began establishing contact with the cell wall; then pressure potential begins building up. From incipient plasmolysis to full turgidity, water potential increases rapidly because pressure potential increases rapidly because of the tightening contact between the protoplasm and the cell wall thus the water potential is being accounted for by both solute potential and pressure potential and since pressure potential is positive; water potential becomes less negative/ tends towards zero. At full turgidity, there is maximum water potential because the cell has expanded to its elastic limit; pressure potential being maximum at this point.
From figure 2:
(c). Describe the effect of increasing extracellular concentration:
(i). on glucose uptake. (07 marks)
The rate of diffusion of glucose initially increases rapidly at lower extracellular fluid concentration; With further increase in extracellular fluid concentration; rate of diffusion of glucose slows down/ increases gradually to attain maximum rate of diffusion and then levels off/ remains constant thereafter.
(ii). on water uptake (05 marks)
Rate of diffusion of water generally increases lineally or directly proportional to extracellular fluid concentration.
(d). Explain the observed rates of uptake of glucose and water. (08 marks)
For glucose uptake;
Rate of diffusion initially increases rapidly because of the very steep concentration gradient permitting fast rate of diffusion. Rate of diffusion increases gradually/ slows down because the carrier proteins are progressively getting saturated with glucose molecules; reducing the number of free carrier proteins. Rate of diffusion finally levels off/ remains constant because the carrier proteins are fully saturated with glucose molecules such that the rate of loading of carrier protein molecules with glucose is equal to that of offloading; None of the carrier proteins is thus available for binding any extra glucose molecules. Concentration gradient ceases.
For Water uptake;
Rate of diffusion increases rapidly following a linear pattern; because an increasing extracellular fluid concentration lowers the relative solute potential but of the cell. Water potential of the cell increases thus water is lost from the cell to the extracellular fluid by osmosis.
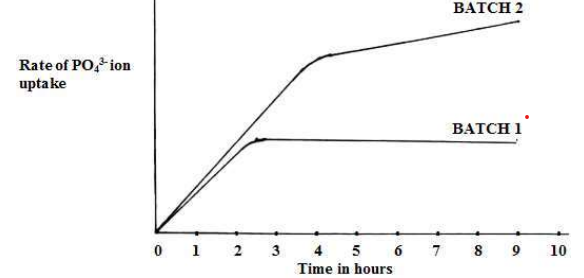
(e). The rate of uptake of phosphate ions by roots of spinach was investigated. Roots were cut into slices & divided into batches. Batch 1 was treated with cyanide after one and half hours of the experiment. Batch two was left as a control. The rate of uptake was investigated at one hour interval and the results recorded as a graph below.
(i). Comment on the effect of cyanide on the rate of uptake of phosphate ions (02 marks)
Cyanide has no effect immediately after it is applied; such that there is still rapid uptake of phosphate ions even after its application. After one hour of its application, rate of uptake remained constant i.e. no more new phosphate ions were taken up.
(e)(ii). Explain the effect of cyanide on the rate of uptake of phosphate ions (08 marks)
The uptake is not affected one hour after application because the roots are storing energy inform of ATP which is used for active transport of the phosphate ions. Besides the concentration gradient is still steep and so the phosphate ions diffuse passively. After one hour of application; the uptake ceased to increase because the concentration gradient had ceased to exist and all the stored energy inform of ATP had been used up. The cyanide now inhibits enzymes of respiration; no more ATP was made and no more active uptake possible which would be the alternative to passive diffusion since the gradient had ceased to exist.
(iii). Compare the rates of uptake for phosphate ions by both batches 1 and 2 (03 marks)
For the first two & half hours of the experiment; in both batches the root slices took up phosphate ions rapidly. Between two and half hours to three and half hours; roots in batch one had stopped taking up phosphate ions but for roots in batch 2, uptake continues to be rapid. Beyond three and half hours of the experiment, roots in batch 2 continue to gradually take up phosphate ions while those in batch 1 ceased to take up phosphate ions.
(iv). Suggest explanations for the differences and similarities in the rate of uptake by roots of both batches
There is rapid uptake in the first two hours of the experiment due to passive diffusion since the gradient is still steep. For batch 2, uptake continues gradually after three and half hours but for batch 1, uptake ceases because the gradient had ceased to exist and any more uptake is by active transport. This is inhibited for batch one because
of the presence of cyanide ion which is a metabolic poison; that inhibits respiration from taking place. For batch
2, uptake continues due to absence of a metabolic/respiratory poison thus respiration continues to release energy
inform of ATP; that continuously runs the active process of taking in phosphate ion intake.
Question 3.
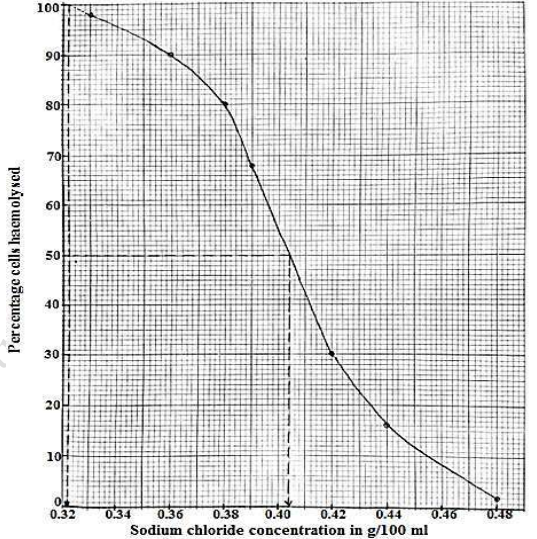
In a physiological investigation, screened red blood cells were placed in different concentrations of aqueous sodium chloride solution. In each case an average total of five thousand cells were viewed and the total number of haemolysed cells recorded. The results of this investigation are shown in the table below.
|
Sodium chloride concentration/g/100 ml
|
0.33
|
0.36
|
0.38
|
0.39
|
0.42
|
0.44
|
0.48
|
|
Number of cells haemolysed x10
3
|
4.9
|
4.5
|
4.0
|
3.4
|
1.5
|
0.8
|
0.1
|
|
Sodium chloride concentration/g/100 ml
|
0.33
|
0.36
|
0.38
|
0.39
|
0.42
|
0.44
|
0.48
|
|
Percentage cell haemolysed (%)
|
98
|
90
|
80
|
68
|
30
|
16
|
2
|
(a)(i). Calculate the percentage cells haemolysed at each sodium chloride concentration.
Percentage cells haemolysed =
number of cells haemolysed
x 100
Average total cells viewed
Average total cell viewed = 5
Percentage cells haemolysed = 20 x number of cell haemolysed
|
Sodium chloride concentration/g/100 ml
|
0.33
|
0.36
|
0.38
|
0.39
|
0.42
|
0.44
|
0.48
|
|
Number of cells haemolysed x10
3
|
4.9
|
4.5
|
4.0
|
3.4
|
1.5
|
0.8
|
0.1
|
|
Sodium chloride concentration/g/100 ml
|
0.33
|
0.36
|
0.38
|
0.39
|
0.42
|
0.44
|
0.48
|
|
Percentage cell haemolysed (%)
|
98
|
90
|
80
|
68
|
30
|
16
|
2
|
(ii). Plot a graph to show variation of percentage cells haemolysed with NaCl concentration
A graph showing the variation in the percentage cells haemolysed with NaCl concentration
(b)Describe the shape of the graph
Percentage cells haemolysed decreases with increase in salt concentration. Initially percentage cells haemolysed
decreases gradually with increase in salt concentration from 0.33 to 0.38g/100ml. Then percentage cells haemolysed decreases drastically/rapidly with increase in salt concentration from 0.39 to 0.42g/100ml. Finally, percentage cells haemolysed decreases slowly with further increase in salt concentration.
(c).Explain the shape of the graph.
In hypotonic solution the red blood cells take up water by osmosis, cell volume increases and the relatively weak plasma membrane bursts releasing the cell contents. Since the bulk of the red blood cells is filled with haemoglobin or bursting a lot of haemoglobin is released hence haemolysis takes place with increase in salt concentration the bathing solution becomes less hypotonic and hence the percentage cells haemolysed gradually decreases. Towards the isotonic salt concentration, there is a drastic decrease in percentage cells haemolysis as the percentage cells haemolysed is almost in balance with the normal and crenated cells. Above the isotonic solution, the red blood cells lose water by osmosis, cell volume decreases and the red blood cells shrink (crenated). Therefore, the percentage cells haemolysed gradually decreases, as more cells are crenated.
(d).From the graph, determine the sodium chloride concentration
(i) At which 100% haemolysis occurs
100% haemolysis occurs at 0.322g/100ml (range is 0.321-0.323)
(ii) isotonic to the red blood cells. (explain your answer)
Isotonic solution is 0.402g/100ml; (range is 0.401-0.403)
At this salt concentration, there is 50% haemolysis. The solution is isotonic to the red blood cells; no net osmosis takes place. The cells haemolysed as a result of water uptake by osmosis in equilibrium with the cells crenated as a result of water loss by osmosis.
(e).Suggest what would happen if the red blood cells were placed in sodium chloride concentration of;
(i) 0.6 g/100ml
This salt concentration is hypertonic to the red blood cells. The red blood cells would lose water by osmosis; cell volume would decrease. The red blood cells would shrink and appear crenated. The percentage cells haemolysed would be very low.
(ii) 0.1g/100ml
This is hypotonic to the protoplasm of red blood cells. Red blood cells would take up water by osmosis; cell volume would increase and the red blood cells would burst releasing haemoglobin. The percentage cells haemolysed would increase.
(f).Give reasons why the red blood cells haemolyse over a wide range of salt concentration.
In hypertonic solution they tend to take up ions such as chloride ions to reduce their osmotic pressure and hence reduce water loss by osmosis. In hypotonic solution the red blood cells tend to lose ions such as hydrogen carbonate ions, to lower their osmotic pressure and hence reduce the chance of taking up water by osmosis which could lead to bursting and hence haemolysis.
(g).Criticize a nurse who injects a patient with distilled water instead of medication for malaria.
The distilled water would make the blood hypotonic to the red blood cells. The red blood cells would take up water by osmosis & burst. This would instead worsen the condition of the patient hence the nurse would have made a grave mistake.
Question 4.
In an investigation, several potato tissue cylinders of approximately equal size were obtained using a cork borer. The cylinders were divided into two groups A and B. The mass of each of the cylinders were measured and recorded. Each of the cylinders in group A were placed in sucrose solution of a given concentration. Cylinders from group B were treated similarly except 0.1g of gibberellic acid (GA) was added to each sucrose solution. The setups were left to stand for 4 hours, then after 4 hours each cylinder was removed from its solution, reweighed and the percentage change in mass calculated. The results obtained were recorded in the table below.
| Sucrose molarity (M) |
Percentage change in mass |
Group A
Sucrose solution only |
Group B
Sucrose solution + GA |
| 0.0 |
+7 |
+42 |
| 0.1 |
+6 |
+38 |
| 0.2 |
+5 |
+36 |
| 0.3 |
+1 |
+27 |
| 0.4 |
-4 |
+6 |
| 0.5 |
-8 |
+3 |
| 0.6 |
-14 |
-3 |
| 0.7 |
-17 |
-4 |
| 0.8 |
-16 |
-7 |
Gibberellic acid(GA) is produced naturally in potato tubers and it stimulates the production of carbohydrase enzyme
(a).What precautions should be taken by the investigator to ensure that accurate results are obtained in this experiment (04 marks)
- Cylinders must be from the same tissue
- Cylinders must be from the same plant
- Volume of sucrose solutions must be the same
- The cylinders must be weighed immediately to eliminate losing mass due to evaporation of water.
- Cylinders must be dried using a piece of tissue to remove excess water
(b)(i).Plot a graph of to show percentage change in mass of cylinders in groups A and B at different sucrose concentrations
(ii).Using the graph for group A; explain how change in concentration of sucrose affected the mass of the cylinders (04 marks)
From 0 to 0.32M sucrose molarity, mass of cylinders increases; the solutions are hypotonic/dilute/less concentrated compared to the cell sap of tissues; the cells in potato tissue cylinders gains water molecules from the surrounding sucrose by osmosis. At 0.32M sucrose solution; no change in mass occurs; the sucrose solution is isotonic to the cell sap of cells in the tissue; no net movement of water occurs: Above 0.32 sucrose molarity, the mass of cylinders decreases; the sucrose solutions are hypertonic/more concentrated than the cell sap of cells in the tissues; cells in the tissue lose water by osmosis to the surrounding sucrose solution;
(iii).Explain the difference in the results obtained for groups A and B at the different sucrose concentrations (07 marks)
Percentage increase in mass for group B is higher than that for group A; Gibberellic acid added diffused into the cells of potato tissues; loosening the cell wall; increasing its extensibility; and allows the water potential of cells; water potential gradient between the cell sap of cells and sucrose solutions increased, allowing faster gains of water by osmosis; from the sucrose solutions; by osmosis; greatly increasing the mass; Percentage decrease in mass for group B is lower than that for group A, water potential of cells of tissues in group B is higher than in group A; less water is lost from cells of tissues in group B to sucrose solutions; decreasing the mass loss
(c)(i).From the graph, state the molarity of sucrose solution which would have the same water potential as the potato cylinders. Give a reason for your answer (02 marks)
(ii).Explain why the water potential of a sucrose solution always has a negative value (02 marks)
Sucrose solutions always contain solute molecules which always reduce the free energy of water molecules present lowering water potential/ solutes reduce water potential since there are fewer water molecules in the solution
(d). State
(i).Two ways in which similar results can be obtained without measuring masses of cylinders (03 marks)
- Determining change in length of cylinders
- Determining change in volume of solutions bathing cylinders
- Determining change in diameter of cylinders
(ii).The precautions necessary when using each of the methods (06 marks)
Determining change in length of cylinders
-
All cylinders must be trimmed to the same length.
-
Accurate timing must be ensured
-
Measurements taken immediately the cylinders are obtained and even after the experiment
-
Determining change in volume of sucrose solutions bathing
-
Solutions accurately delivered to measuring cylinders.
-
Experiment carried out in graduated test tubes/measuring cylinder
-
Determining change in diameter of cylinder
-
Cork borers used must be of uniform diameter
-
Averaged measurements taken
Question 5.
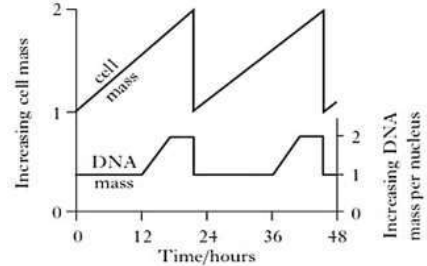
Figure 1 below shows changes in the quantities of nuclear DNA and cell mass during repeated cell cycle.
(a). For one cell cycle only, describe the changes in:
(02½ marks)
(i) Mass of DNA
One cell cycle lasts from 0 hour to about 23 hours; DNA mass remains constant from 0 to 12 hours; increases rapidly to about 18 hours; remains constant up to about 23 hours; decreases suddenly to original mass at about 23 hours;
(ii) Cell mass
Cell mass increases rapidly from 0 hour to a peak at about 23 hours; Decreases suddenly; to original mass at about 23 hours;
(b) For one cell cycle only, explain the trend in:
(08 marks)
(i) Mass of DNA
From 0 hour to 12 hours is the first growth (G1) phase; cell contents replicate except DNA; from 12 hours to about 18 hours is the synthesis (S) phase; DNA replicates to double original mass; from 18 hours to about 23 hours is the second growth (G2) phase and mitosis; no DNA synthesis at about 23 hours; cytokinesis occurs; halving the DNA mass in each new cell to the original mass.
(ii) Cell mass
0 hour to about 23 hours marks the period of interphase and mitosis; during which organelles like mitochondria, cytoskeletal elements, endoplasmic reticula, ribosomes, Golgi apparatus, etc. replicate and increase in number; and the cell grows (G1 phase); DNA replicates; and the chromosome content doubles; histones and other nuclear proteins are synthesized (S phase); Synthesis of additional proteins that support cell metabolism occurs (G2 phase); At about 23 hours cytokinesis divides the parent cell into equal sized daughter cells;
(c). Explain the significance of the observed changes in mass of DNA from 12 to about 23 hours.
(08 marks)
From 12 hours to about 23 hours the mass of DNA increases rapidly to double the original mass; so that each daughter cell produced by cytokinesis has the exact genome as it is in the parental cell;
In figure 2 below, the graphs represent changes during mitosis in the distance between:
(i). Centromeres of chromatids and pole of the cell.
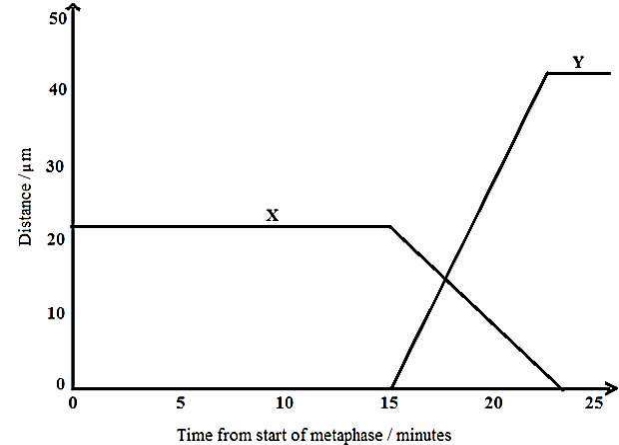
(d) Identify what curves X and Y represent
X represents distance between centromeres of chromatids and cell poles;
Y represents distance between centromeres of sister chromatids;
(e) Explain the trend in distance represented by:
(i) Curve X
From 0 minute to about 15 minutes the distance between centromeres of chromatids and poles of the cell is relatively long; and remains constant; because the cell is in metaphase stage; chromosomes are at metaphase plate; with sister chromatids still held at centromeres; From about 15 minutes to about 23 minutes the distance between centromeres of chromatids and poles of the cell decreases rapidly to 0 μm; because after split-ting during anaphase stage; sister chromatids are pulled rapidly towards poles by microtubules (spindle); and eventually arrive at the poles during telophase stage;
(ii) Curve Y
From 0 minute to about 15 minutes the distance between centromeres of sister chromatids was 0 μm; because sister chromatids were still joined at their centromeres during anaphase; From about 15 minutes to about 23 minutes the distance between centromeres of sister chromatids increased rapidly to a maximum; because after splitting during anaphase stage; sister chromatids are separated from each other rapidly by the pulling of microtubules (spindle) towards poles; After about 23 minutes the distance between centromeres of sister chromatids is very long and remains constant; because sister chromatids have arrived at the respective poles during telophase stage;
(f) Explain the variation in the maximum distance achieved in X and Y
The maximum distance for Y (between centromeres of sister chromatids) is almost twice longer than for X (distance between centromeres of chromatids and poles); During metaphase, chromosomes are at metaphase plate which is equidistant from either pole of the cell therefore maximum for X is shorter; Maximum for Y is longer since spindles pull chromatids to the extremes of the cell (poles) which are very distant apart

